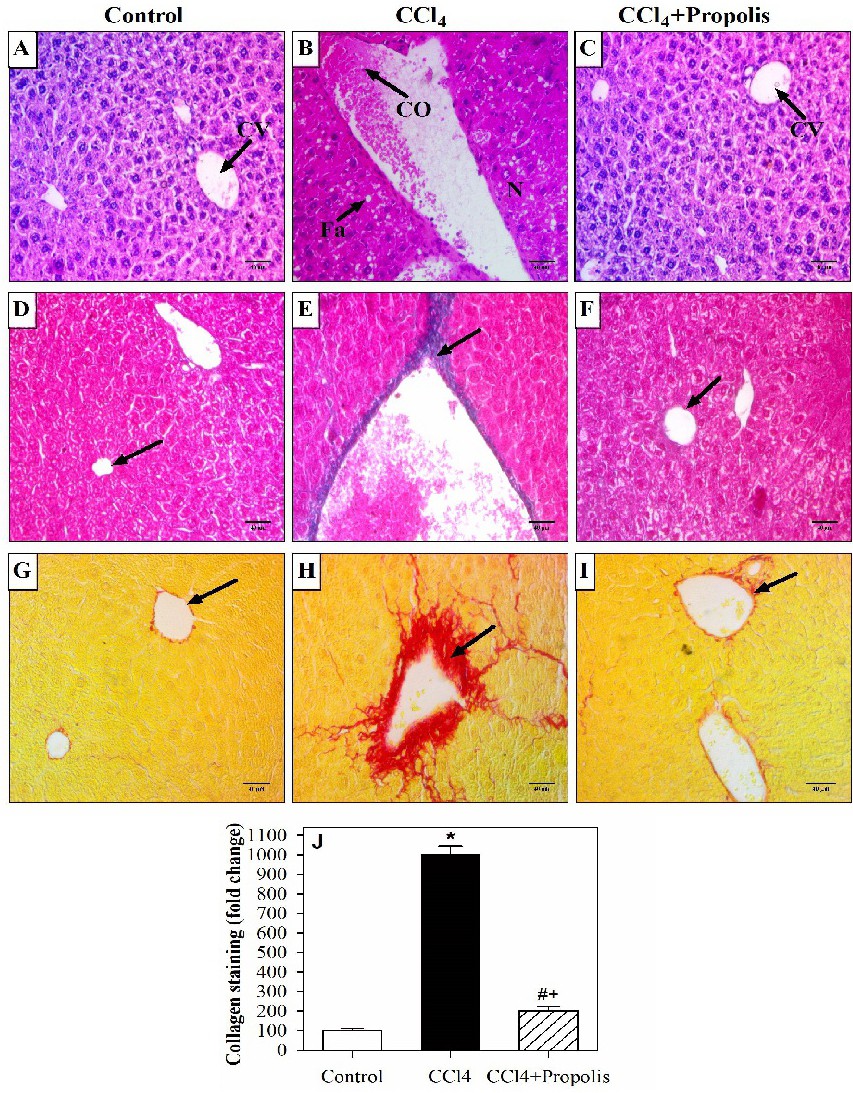
Fig. 1. Induction of a fibrotic mouse model by CCl4 and the effect of propolis on the liver architecture. Histological changes were assessed by H&E, Masson's trichrome and Sirius red staining standard protocols. All images are at x200 magnification and are representative of samples from mice in each group. Photomicrographs of liver sections from the control, CCl4-treated and CCl4+propolis-treated groups stained with H&E (A-C), Masson's trichrome (D-F), or Sirius red for collagen deposition (G-I). Quantification of collagen staining in the liver sections from three animals per group was analyzed using NIH ImageJ software (J). The collagen level of the control group was set as the basal level. Data are expressed as the mean ± SEM. *P<0.05 for CCl4-treated mice versus control mice. #P<0.05 for CCl4+propolis-treated mice versus CCl4-treated mice. +P<0.05 for CCl4+propolis-treated mice versus control mice (ANOVA with Tukey's post-test).